The next generation Ti-based corrosion & wear-resistant material "TX1", which combines excellent wear-resistance equivalent to cemented carbides with exceptional corrosion-resistance, has been developed. The hardness (wear-resistance), which is a disadvantage of conventional Ti-based hard material, has been improved dramatically because of change of Ti/C atom ratio in TiCx raw powder. This reason is that phase content of TiCx in sintered alloy is increased by relatively increasing fine TiCx powder content through making Ti/C atom ratio in TiCx raw powder larger. And another reason is that grain size in sintered alloy can be reduced by sintering at lower temperature due to acceleration of densification. It has been confirmed that TX1 is an alloy combining excellent wear & corrosion-resistance with good tribological property.
Cemented Carbides are widely used for wear-resistant materials such as cutting tools and molds because of excellent mechanical properties including high hardness and strength. Recently market needs to use the wear-resistant materials as mechanical seals, sleeve parts for ceramics bearing to be additionally required corrosion-resistance are growing. The Ti-based hard material (material name: TM2 and TW3) having excellent corrosion-resistance has hitherto been developed [1][2][3][4], and applied especially for sliding bearing installed in sea-water pump. These Ti-based hard materials (TM2 and TW3), however, has not only outstanding corrosion-resistance, but also poor wear-resistance and tribological property, causing that they cannot have satisfied the market needs enough. In the present work, the effect of Ti/C atom ratio in TiC raw powder to behaviors of sintering, corrosion and tribology were investigated, and this paper presents the next generation Ti-based corrosion & wear-resistant material "TX1" combining excellent wear and corrosion resistance with good tribological property.
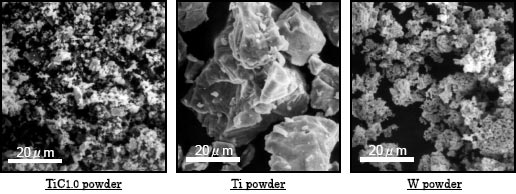
A commercial Ti powder (under #325 mesh), Mo powder (mean particle diameter of 4? 10-6m), W powder (1?10-6m) and TiCx powders (X=0.5, 0.75 and 1.0) (1?10-6m) as shown in Fig.1 were mixed to the specified composition: W1, W2 and W3 alloys (see Table 1) at a constant atom ratio of Ti/W/Mo/C by using a fluidizing mixer in argon gas for 3.6 ks, and pressed into shape at a pressure of 0.2 GPa. They were obtained by vacuum pre-sintering at 973K and vacuum sintering at 973 to 1873K for 3.6ks. For the obtained alloys, the sintering behavior and physical properties were measured to investigate the effect of Ti/C atom ratio in TiCx raw powder through SEM observation of alloy structure and X-ray diffraction analysis.
| Sample name | TiC0.5 | TiC0.75 | TiC1.0 | Ti | Mo | W | C content |
|---|---|---|---|---|---|---|---|
| W1 alloy (TiC1.0) | 0 | 0 | 40.30 | 34.46 | 2.96 | 22.28 | 8.08 |
| W2 alloy (TiC0.75) | 0 | 51.04 | 0 | 23.72 | 2.96 | 22.28 | |
| W3 alloy (TiC0.5) | 72.52 | 0 | 0 | 2.24 | 2.96 | 22.28 |
For the new material "TX1" obtained by optimizing Ti/C atom ratio in TiCx raw powder, the physical properties of TX1 were investigated and compared with a conventional cemented carbide (WC-15mass%Co alloy). The corrosion behavior of TX1 was studied by electro-chemical measurement such as potentio-dynamic polarization curves (Counter electrode: Pt, Potential range: -1 to +1.5V vs. Ag/AgCl, Scanning rate: 1mV/sec) in an acid (3%NaCl+0.1N-H2SO4) solution and neutral(3%NaCl) solution at 297K. The experiment was carried out by using the tribological testing machine for underwater sleeve as shown in Fig.2 to evaluate the tribological properties of TX1. In the experiment the change of rotational torque was measured with rotating test sample sleeve including TX1 under pressing SiC retainer by pneumatic cylinder. The retainer contacts sleeve on the center angle of 88 degree. (see Fig.3) The contact width on shaft axis direction on retainer is 10mm. The value of PV means the products of pressure, i.e. (load) / (orthographic projection area), and circumferential velocity, it came to be an important characteristic for evaluation in terms of tribology. Phased running experiment and 100 hours continuous running experiment was carried out in order to measure the value of PV and stability of its tribological performance respectively. The experimental conditions are shown in Table 2.
| Phased running experiment |
100 hours continuous running experiment |
|
|---|---|---|
| Material of sleeve | TX1 / G3 [*1] / TW3 [*2] | TX1 / G3 [*1] / TW3 [*2] |
| Material of retainer | SiC (Hardness HRA94, S.G. 3.1) | |
| Sleeve revolution speed / rpm | 1150 | 1525 |
| Circumferential velocity / m/sec | 3.0 | 4.0 |
| Retainer Load / N | 196 – 784 (98N Step) | 980 |
| Holding time / sec | 900 | 0.36×10⁶ (100 hours) |
| Water in tank | Industrial treated water (pH 7.4) | |
| Water temperature / K | 293 | |
The relationship between sintering temperature and hardness on each alloy is shown in Fig.4. W2 and W3 alloys showed higher hardness than W1 alloy in the whole range of sintering temperature, and W3 reached maximum hardness of HRA88.7 at sintering temperature of 1573K. Considering from the relationship between sintering temperature and relative density on each alloy (Fig.5) and measured results of linear shrinkage, the progress of densification was W3 alloy, W2 alloy and W1 alloy in decreasing order as compared each other at the same sintering temperature. Fig.6 shows SEM image photograph of microstructure for each alloy at sintering temperature of 1573K. For every alloys, gray white area and dark area are ? -Ti phase and TiCx phase respectively. Analyzing these photographs, it can be seen that alloy phase content of TiCx is W3 alloy, W2 alloy and W1 alloy in decreasing order. From the above, it is supposed that the reasons, which hardness of W2 and W3 alloys is higher than that of W1 alloy in the range of lower temperature, are the acceleration of densification and increase of alloy phase content of TiCx due to increase of Ti/C atom ratio in TiCx raw powder.
Also the X-ray diffraction patterns of these alloys sintered at 1573K are shown in Fig.7. While every alloys mainly consisted of ?-Ti phase and TiCx phase, it was found that the peak of retained W increased with increase of Ti/C atom ratio. Table 3 shows the estimated Ti/C atom ratio in TiCx phase after calculating lattice parameter by peak position data of TiCx phase. Then, the reason that alloy phase content of TiCx is W3 alloy, W2 alloy and W1 alloy in decreasing order, is that Ti/C atom ratio in TiCx phase changes according to change of Ti/C atom ratio in TiCx raw powder.
| W1 alloy (TiC1.0) | W2 alloy (TiC0.75) | W3 alloy (TiC0.5) | |
|---|---|---|---|
| Lattice parameter (nm) |
4.317 | 4.314 | 4.307 |
| Estimated Ti/C atom ratio in TiCx phase |
TiC0.62 | TiC0.60 | TiC0.55 |
| Change of Ti/C atom ratio in TiCx phase after sintering |
△0.38 [TiC1.0→TiC0.62] |
△0.15 [TiC0.75→TiC0.60] |
▲0.05 [TiC0.50→TiC0.55] |
Fig.8 indicates the relationship between 3 points bending transverse rupture strength (TRS) and sintering temperature on each alloy. The position of maximum TRS of W1, W2 and W3 existed at sintering temperature of 1673, 1673 and 1573K respectively, and the maximum TRS value were W3, W2 and W1 in decreasing order. The sintering temperature for maximum TRS shifted on the lower temperature side because the sintering densification was accelerated by increasing Ti/C atom ratio in TiCx raw powder as stated above.
Fig.9 shows SEM image of microstructure of W1 and W3 alloy sintered at the range of 1373 to 1873K. According to the audit observation, it could be found that TRS decreased because of increase of pore up to the maximum TRS temperature, because of coarsening of ?-Ti and TiCx phase over the temperature respectively. Also, it was confirmed that for W1 alloy coarse TiCx phase was first crystallized (TiC1.0 + Ti → TiCx), that for W3 alloy the densification was accelerated through starting sintering densification among fine TiCx raw powders at lower temperature (TiCx+TiCx→TiCx').